


Author Monica Muir, of Muir & Associates is an NALP consultant member.
Many small business owners focus on generating more revenue every year, and that’s a great objective. But not all income is created equally. If you have more than one type of division/service and/or service/product, then it’s worthwhile taking a closer look at the profitability of each.
Although it’s fun to watch your income grow, it’s the bottom line (your profit) that really matters. If your expenses grow faster than your profits, that means you have a lot of activity going on, but you don’t get to keep as much of what you make – and that’s what really matters.
One way to increase your profitability is to increase your most profitable division/product line/service and do less of the least profitable of your divisions in terms of dollars. You’ll want to run reports to help you compare. (For those of you who use QuickBooks, Classes can make this an easy task.) And for those of you who have projects/jobs (which is most of you reading this), then I’m hoping that your job costs are in the cost of goods section so you can compare profitability of your different divisions before you look your bottom line after overhead expenses.
So let’s take a look at your revenue mix.
Your Revenue Mix
Let’s say you offer three different services: Services X, Y, and Z. To keep the math simple we’ll say your revenue pie looks like this:
X: $700,000 or 70% of the total 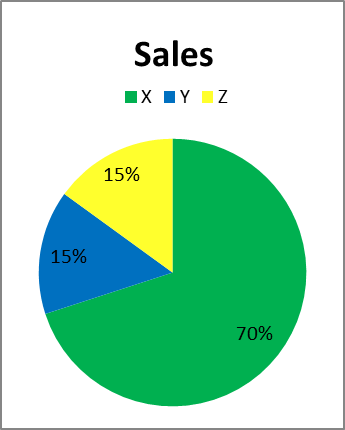
Y: $150,000 or 15% of the total
Z: $150,000 or 15% of the total
Total: $1.0 million
In this example, Service X is clearly the service making the most revenue in your business. But is it really the most profitable?
Let’s say you notice that the profit you receive from each of these service lines is as follows:
X: $80K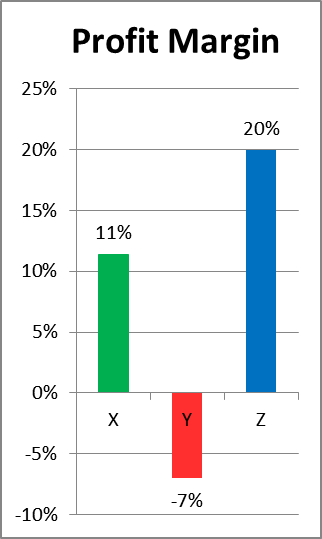
Y: $10K loss
Z: $30K
Total: $100K
While Service X is generating the most profit dollars for your business, it’s actually Service Z that’s the most profitable. Earning $80K on $700,000 yields 11.4% profit margin on Service X, but earning $30K on $150K yields nearly double the profit margin at 20%. So Service Z generates the higher profit margin. Depending on your accounting and other software programs, you can take a deeper dive behind those numbers, taking a look at type of customer, type of job, location, etc. which can guide you in your analysis and decision-making.
Optimizing Profits
Your strategy for a more optimum revenue mix might be to sell as much of Service Z as possible, while eliminating or fixing the problem around Service Y.
Of course, there are many more variables besides profit, such as:
- Which service do you prefer to work on?
- Are you able to sell more of the most profitable service or are there marketing limitations?
- Is one service a loss leader for the others?
- Are you able to adjust price on the lower margin services to increase your profits?
- Is one type of customer more profitable than a different type for the same service?
A New Year, A New Mix
So spend some time analyzing your revenue mix and see what changes you might want to make for 2017.